Scripting is important for memory and/or for automating data processing. However, repeatedly typing the same commands quickly becomes cumbersome in particular when discovering new data. Interactive exploration of data is now available through the following set of commands
          LAS90> file in 12co21-newfmt-base.30m
          LAS90> set source YOUR-SOURCE
          LAS90> set line 12CO(2-1)
          LAS90> set tele 30M-V03-A230
          LAS90> go explore
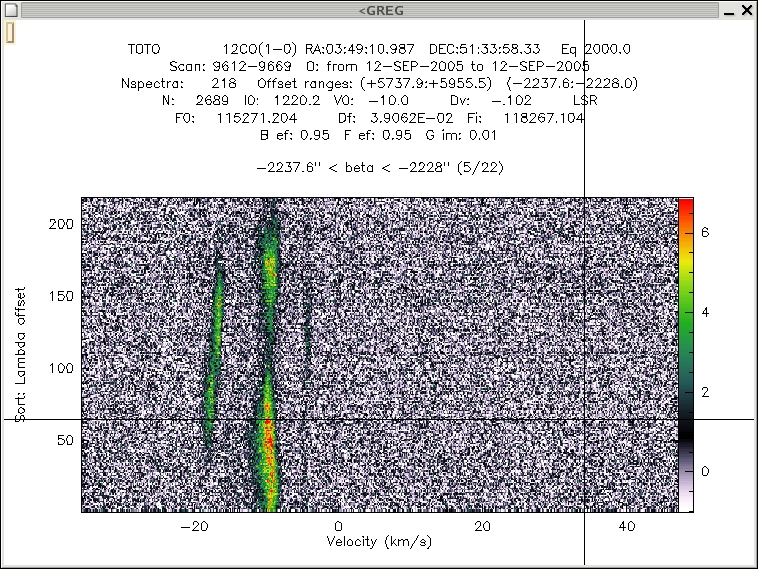
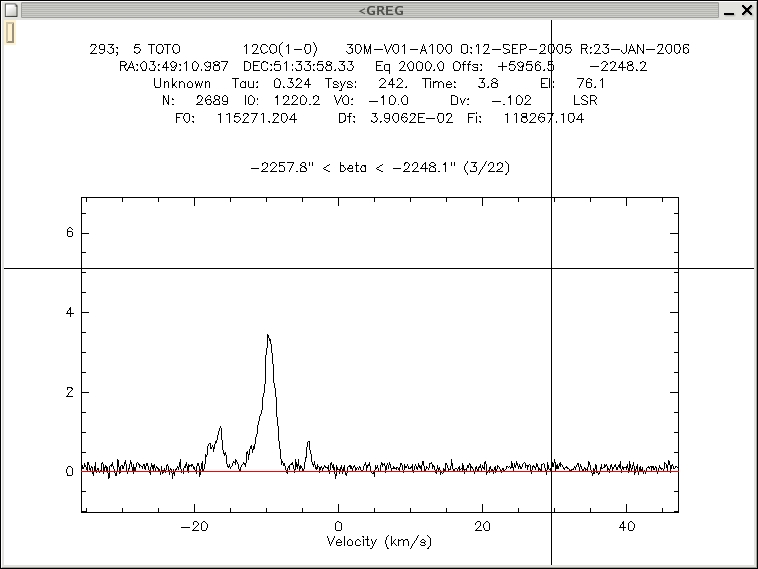
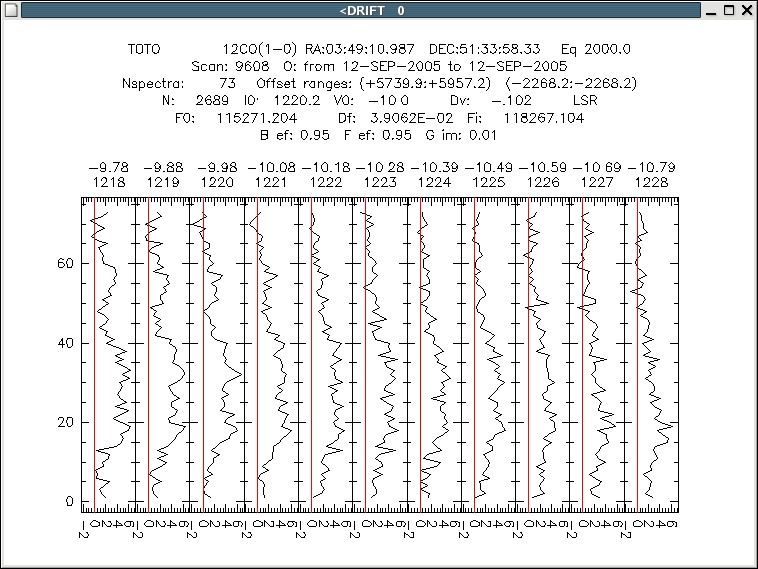
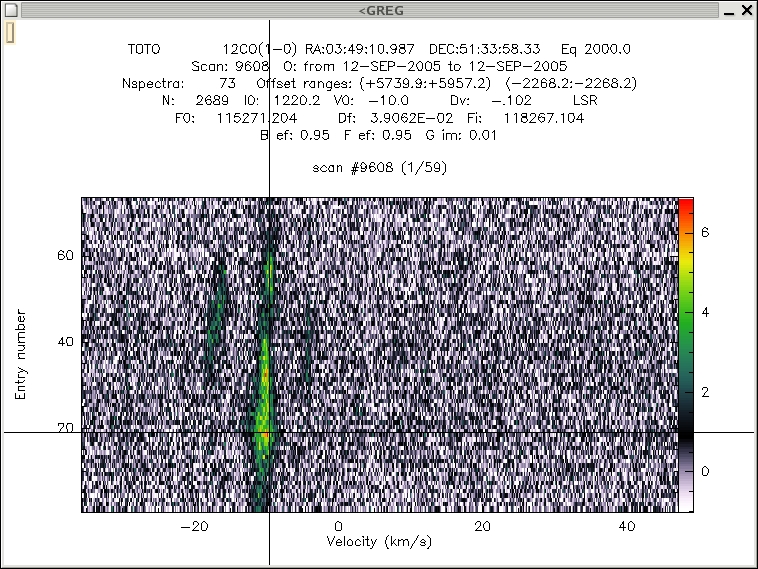
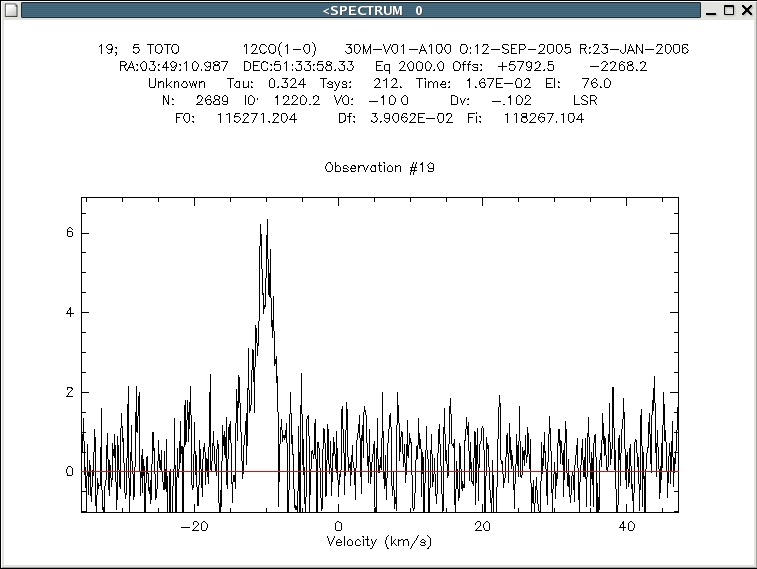
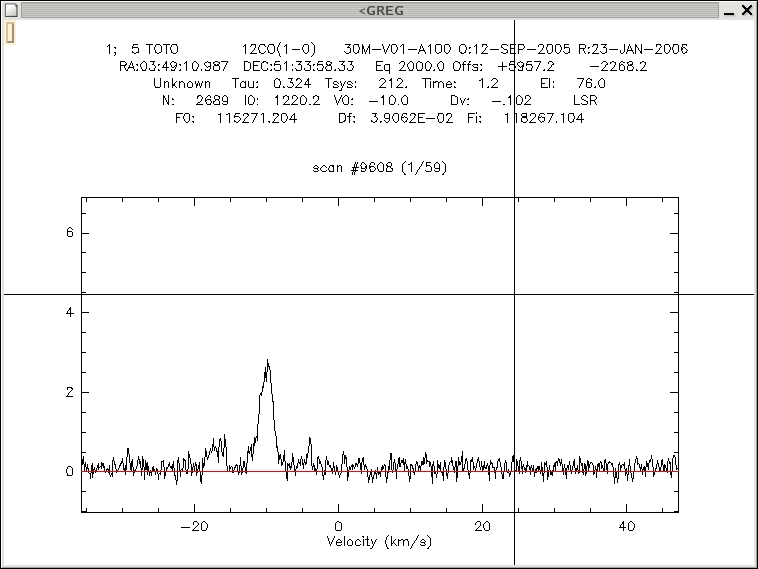
``go explore'' enables loop visualization of data scan by scan or
by offset range (as in section ![[*]](crossref.png) ). It is possible to visualize
a 2D image or the average of the observations. Zoom are easily accessible
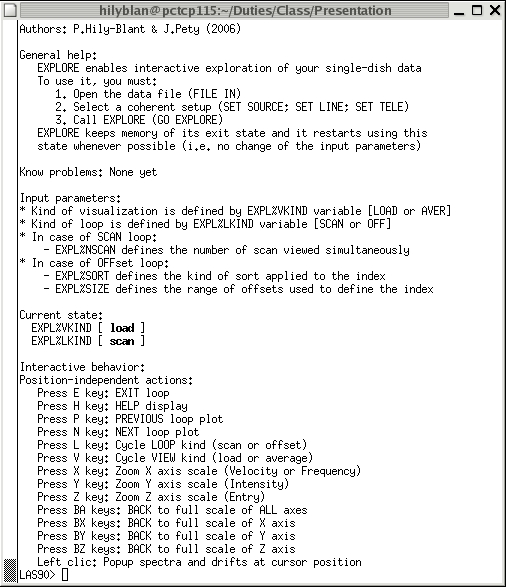
as well as popups of spectra and drifts. An up-to-date summary of the
possibility is available by typing input explore. ``go
explore'' is best used in conjunction with the possibility to easily
select a consistent setup. To do this (i.e. exploring a subset of its
input data file), the user must select this setup through the set
command because the ``go explore'' script issues many intermediate
find commands. Both functionalities (selection and exploration)
are merged in the Explore Data File widget of the CLASS90 main
menu. Examples are given in Figs. to .
). It is possible to visualize
a 2D image or the average of the observations. Zoom are easily accessible
as well as popups of spectra and drifts. An up-to-date summary of the
possibility is available by typing input explore. ``go
explore'' is best used in conjunction with the possibility to easily
select a consistent setup. To do this (i.e. exploring a subset of its
input data file), the user must select this setup through the set
command because the ``go explore'' script issues many intermediate
find commands. Both functionalities (selection and exploration)
are merged in the Explore Data File widget of the CLASS90 main
menu. Examples are given in Figs. to .
|
|