In the previous visualization, the dumped spectra were order according to
their observation number, which most often corresponds to the observing
time sequence. However, it often happens that two sequential OTF scans
belongs to 2 far-away part of the same source. It is thus desirable to be
able to sort dumped spectra in the index by coordinates. In CLASS90,
the ``set sort keyword'' command defines the sorting that will be
applied when the index will be built by the next find command. In
particular, the keyword may be lambda or beta.
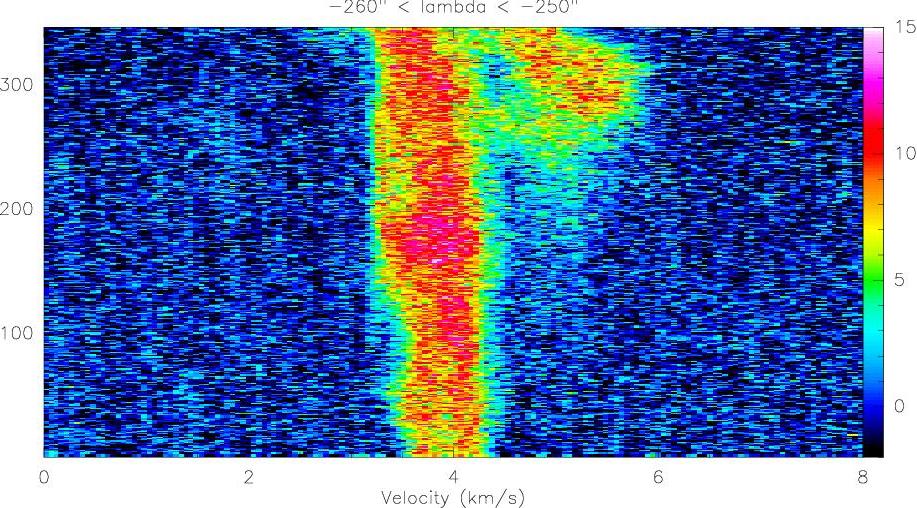
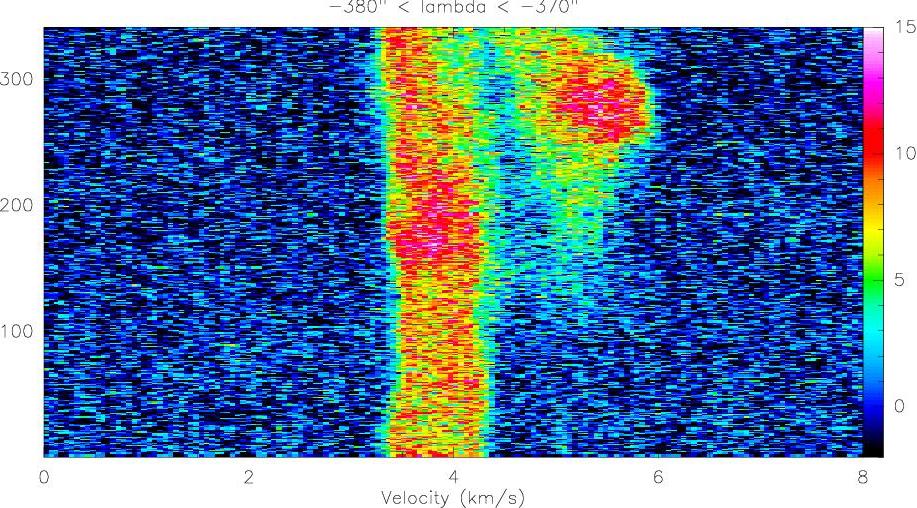
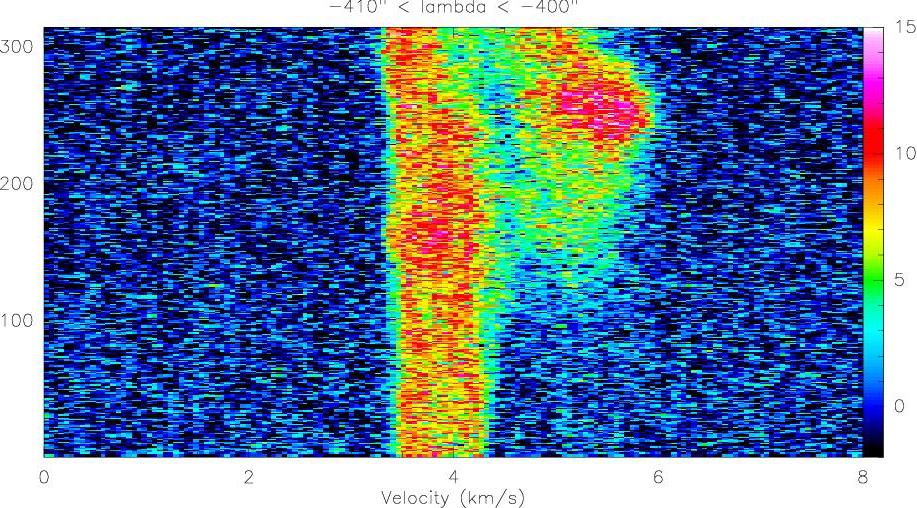
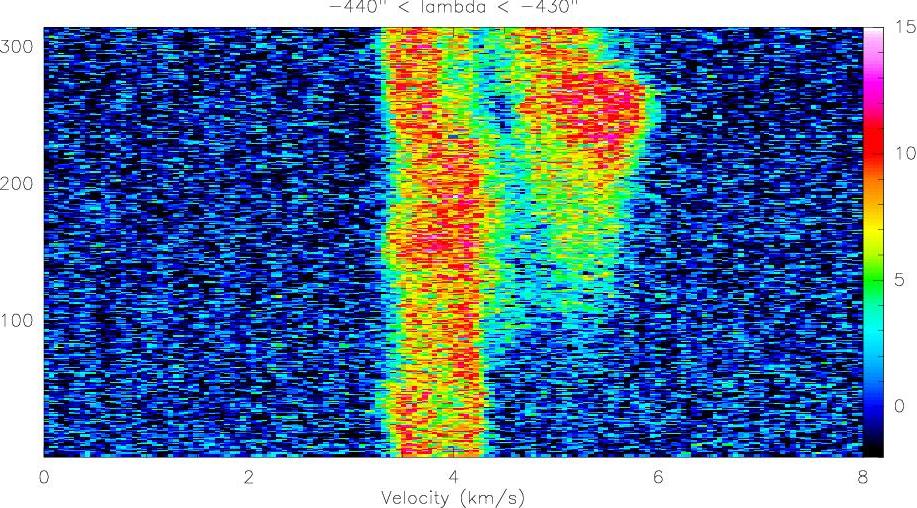
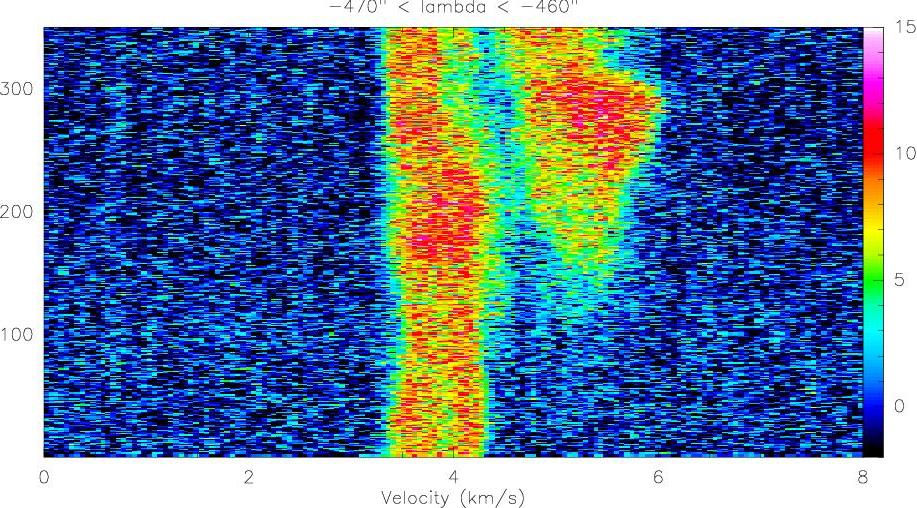
Fig. ![[*]](crossref.png) shows the results of the following commands
shows the results of the following commands
          LAS90> set mode y 0 8
          LAS90> set angle second
          LAS90> set sort beta
          LAS90> for ilambda -470 to -260 by 30
          LAS90>    find /range 'ilambda' 'ilambda+10' * *
          LAS90>    if (found.ne.0) then
          LAS90>       load
          LAS90>       plot /index
          LAS90>       g\draw text 0 1 'ilambda'"` < lambda < "'ilambda+10'"`" 5 /char 8
          LAS90>       list
          LAS90>       pause
          LAS90>    endif
          LAS90> next
which enables to view the dumped spectra with a good continuity in
intensity.
|