The narrow-band correlator has 8
independent units, which can be placed anywhere in the 100-1100MHz
band (1GHz bandwidth), by steps of 0.25MHz. Each unit can be
operated in seven modes, as shown in Table ![[*]](crossref.png) . Each mode
is characterized in the following by couples of total bandwidth/number
of channels. In the 3 DSB modes (320MHz/128, 160MHz/256, 80MHz/512 -
see Table ) the two central channels may be perturbed
by the Gibbs phenomenon if the observed source has a strong
continuum. When using these modes, it is recommended to avoid
centering the most important part of the lines in the middle of the
band of the correlator unit. In the remaining SSB modes (160MHz/128,
80MHz/256, 40MHz/512, 20MHz/512) the two central channels are not
affected by the Gibbs phenomenon and, therefore, these modes may be
preferable for some spectroscopic studies. Because of signal
apodization, the effective spectral resolution is slightly broader
than the channel spacing (by about a factor 1.6 in the standard case
on Plateau de Bure, that uses a Welch time-lag window).
. Each mode
is characterized in the following by couples of total bandwidth/number
of channels. In the 3 DSB modes (320MHz/128, 160MHz/256, 80MHz/512 -
see Table ) the two central channels may be perturbed
by the Gibbs phenomenon if the observed source has a strong
continuum. When using these modes, it is recommended to avoid
centering the most important part of the lines in the middle of the
band of the correlator unit. In the remaining SSB modes (160MHz/128,
80MHz/256, 40MHz/512, 20MHz/512) the two central channels are not
affected by the Gibbs phenomenon and, therefore, these modes may be
preferable for some spectroscopic studies. Because of signal
apodization, the effective spectral resolution is slightly broader
than the channel spacing (by about a factor 1.6 in the standard case
on Plateau de Bure, that uses a Welch time-lag window).
In addition to the spectra produced every integration time (subscan in the OBS terminology), the correlator units output every second the visibility for a pseudo-continuum channel created by averaging data from several spectral channels.
| Spacing | Channels | Bandwidth |
Mode |
| (MHz) | (MHz) | ||
| 0.039 | 1 x 512 | 20 | SSB |
| 0.078 | 1 x 512 | 40 | SSB |
| 0.156 | 2 x 256 | 80 | DSB |
| 0.312 | 1 x 256 | 80 | SSB |
| 0.625 | 2 x 128 | 160 | DSB |
| 1.250 | 1 x 128 | 160 | SSB |
| 2.500 | 2 x 64 | 320 | DSB |
The 8 units can be independently connected to the first or the second
correlator entry, as selected by the IF processor (see above). Please
note that the center frequency is expressed in the frequency range
seen by the narrow-band correlator, i.e. 100 to 1100MHz. The
correspondence to the sky frequency depends on the parts of the 3.6GHz
IF1 bandwidth which have been selected as correlator inputs and
on the selected receiver side band (LSB or USB): Use the
ASTRO software (see Sect. ) to display the relation
between sky- and IF1 frequencies.
The spectral configuration of the narrow-band correlator is selected with the OBS program by the two commands
 OBS\NARROW Qi Qj /RECEIVER Band_Number
 OBS\SPECTRAL Unit Bandpass IF3_Frequency /NARROW Narrow_input -
                                          [/CONTINUUM Band_C IF3_C] -
                                          [/BAND Mode] -
                                          /RECEIVER Band_Number
where
for more details).
for more
details).
The /CONTINUUM option can be used to specify a pseudo-continuum channel to be generated from a subset of the bandpass analyzed by the correlator unit. This subset is defined by Band_C, the pseudo-continuum channel width in MHz, and IF3_C, the center frequency of the pseudo-continuum channel. If not specified, a pseudo-continuum channel containing 87.5 % of the sampled bandwidth is produced.
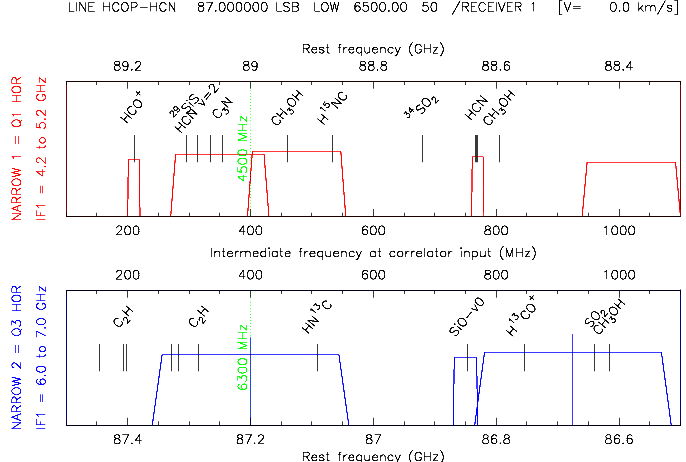
Here is an example of commands showing how to configure the 8 units for a (presumably) typical 3mm project.
NARROW Q1 Q3
!     Selects the 4.2 GHz - 5.2 GHz and 6 GHz - 7 GHz windows of the 4-8 GHz
!     IF1 band. Polarization is HH.
!
SPECTRAL 1 160 1020 /CONTINUUM 100 1000 /NARROW 1 /RECEIVER 1
!     Correlator unit #1 covers the [940,1100] IF3 band on the first IF input
!      (4.2 GHz - 5.2 GHz) with pseudo-continuum of [950,1050]
!
SPECTRAL 2 20 210 /NARROW 1 /RECEIVER 1
!     Correlator unit #2 samples a relatively narrow line centered at 210 MHz
!      in the IF3 band of the first correlator input
!
SPECTRAL 3 20 770 /NARROW 1 /RECEIVER 1
!     Correlator unit #3 samples another one at 770 MHz
!
SPECTRAL 4 160 350 /CONTINUUM 50 395 /NARROW 1 /RECEIVER 1
!     Correlator unit #4 covers the [270,430] IF3 band on the first correlator
!     input with pseudo-continuum of [370,420]
!
SPECTRAL 5 160 475 /NARROW 1 /BAND DSB /RECEIVER 1
!     Correlator unit #5 covers the [395,555] IF3 band on the first correlator
!     input with default pseudo-continuum [405,545]
!     Provides twice as many channels as the previous setting, but the
!     central two channels are affected by the Gibbs phenomenon
!
SPECTRAL 6 40 750 /NARROW 2 /RECEIVER 1
!     Correlator unit #6 covers the [730,770] IF3 band on the second IF input
!     (6 GHz - 7 GHz)
!
SPECTRAL 7 320 400 /NARROW 2 /RECEIVER 1
!     Correlator unit #7 covers the [240,560] IF3 band on the second correlator
!     input
!
SPECTRAL 8 320 925 /NARROW 2 /RECEIVER 1
!     Correlator unit #8 covers the [765,1085] IF3 band on the second correlator
!     input
Figure displays this example of frequency coverage.
Given the flexibility of the correlator, no general rules exist to configure it.
 |