The functionalities of the old ANALYSE\GRID command has been
redistributed and extended in several commands:
ANALYSE\TABLE creates a table containing the offsets, weights
and intensities of all the dumped spectra. A check of the consistency of
the observations in the current index is performed at this step, if not
already done before.
MAP\XY_MAP grids the dumped spectra from the table to an lmv
cube. An image of the associated weights is also produced for further
processing like optimal combination of several data cubes.
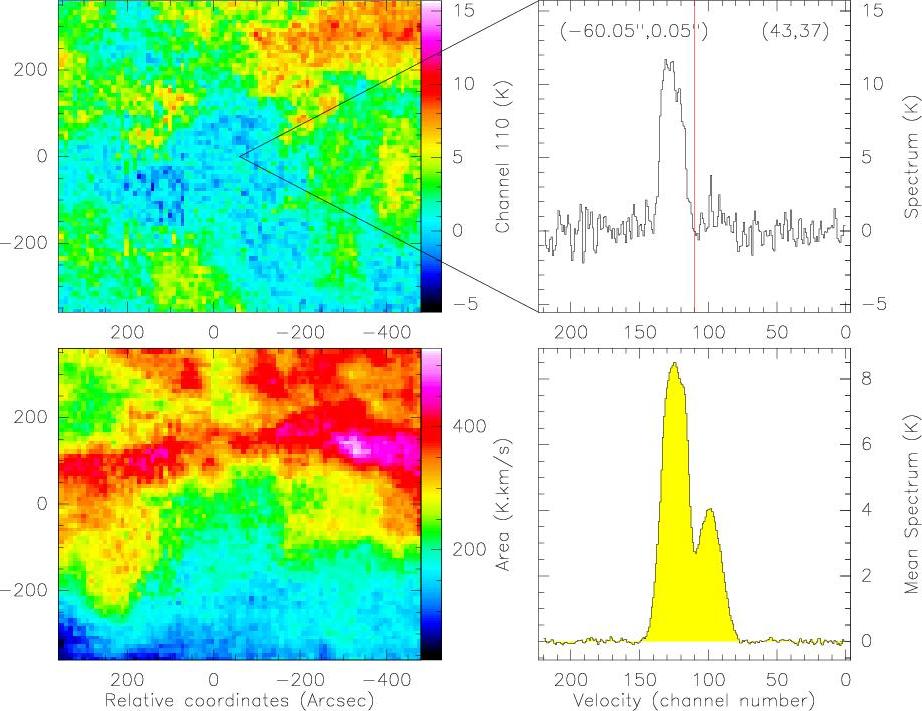
![[*]](crossref.png) has been
obtained with the following sequence of commands:
has been
obtained with the following sequence of commands:
          LAS90> file in 12co21-newfmt.30m
          LAS90> find
          LAS90> table 12co21 new
          LAS90> xy_map 12co21
          LAS90> let name 12co21
          LAS90> let type lmv
          LAS90> go view
The ``go view'' scripts enables interactive visualization of a
spectra cube. Channel maps may be produced through the go bit
command and position-velocity diagrams through the go xv and
go vy commands.
|