next up previous contents
Next: Sorting Up: Large dataset processing Previous: Index consistency   Contents

Visualization

Figure: Time series of the intensity as a function of velocity of 9000 dumped spectra part of 200 OTF scans. Only 7 commands are needed to obtain this result, 4 of which are mandatory and 2 of which just there to improve the visual aspect.
Image class-evol1-index

The following list of commands is all you need to plot as a single image
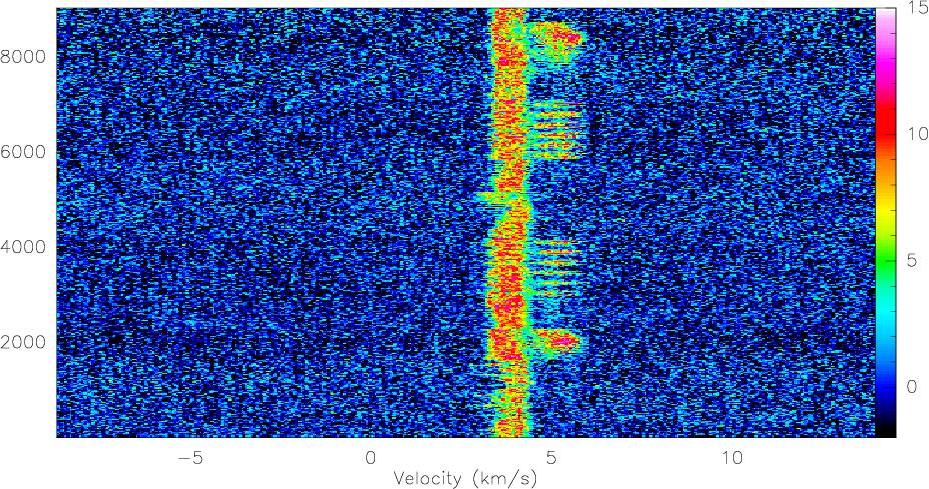
 (see Fig. [*]) 9000 dumped spectra part of 200 OTF scans observed in $\sim$ 4 hours.

          LAS90> lut rainbow3
          LAS90> file in 12co21-newfmt.30m
          LAS90> find
          LAS90> load
          LAS90> set mode y -2 15
          LAS90> plot /index


Gildas manager 2014-07-01