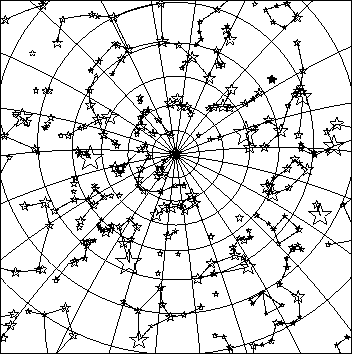
The CONSTELLATION command plots the main constellations stars
in the FRAME area, using the current pen and marker. The marker
size will scale acrording to the star magnitude. Options are available
to draw lines between stars (to form classical constellation outlines)
or plot the star names. See the corresponding section of language
internal help for details.
Example - Figure ![[*]](crossref.png) shows the plot resulting
from the commands:
shows the plot resulting
from the commands:
  FRAME EQ 12:32:54 75:30:33 180.0  ! an equatorial frame
  GREG\SET MARKER 5 2 1
  CONSTELLATION /DRAW M L           ! draws the stars and the lines