Sample Screenshots of VOPlot 3D
For more information on VOPlot 3D click here.
Figure 1: Sample scatter plot that shows points arranged in 3
planes
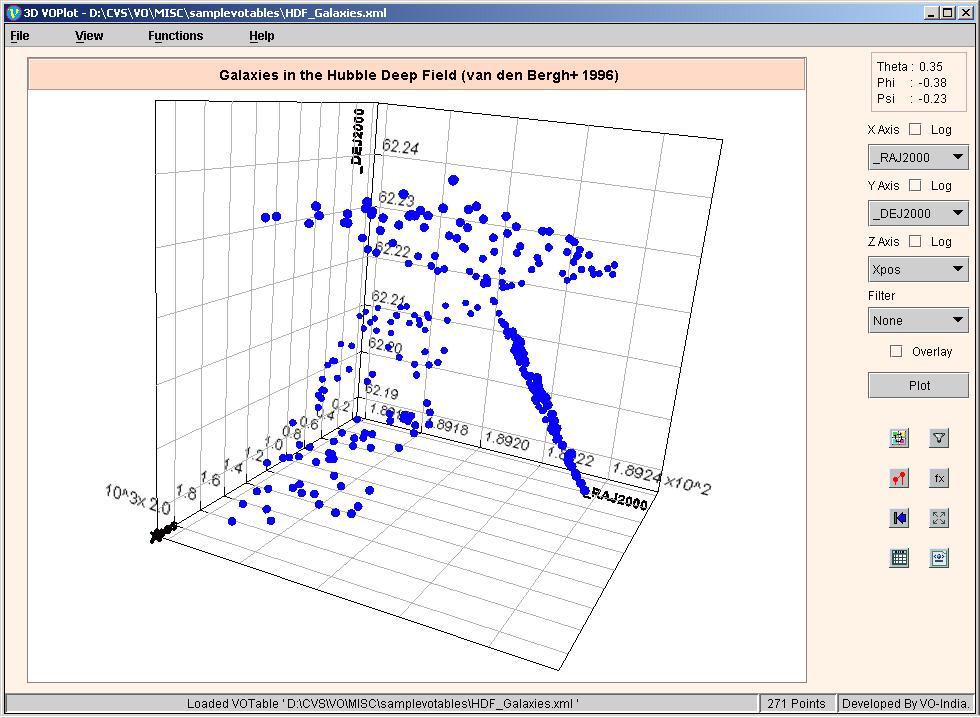
Figure 2: Sample overlaid plot that shows points arranged in
2 planes.
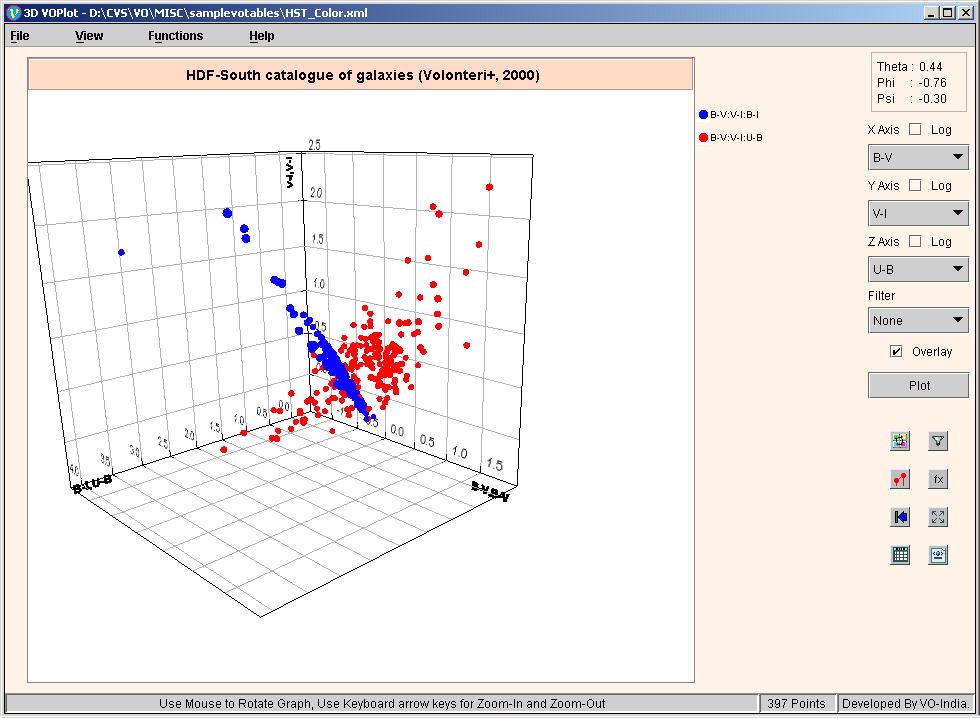
Figure 3: Basic statistics in 3D VOPlot.
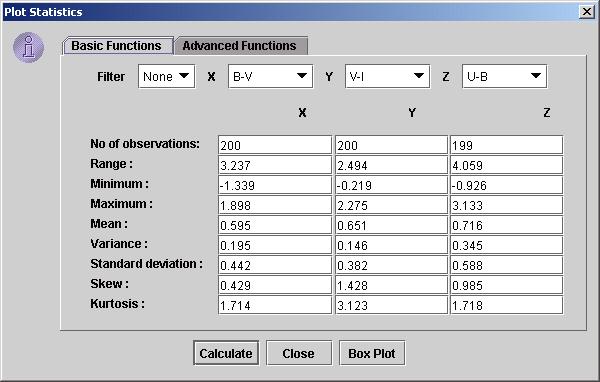
Figure 4: Advanced statistical functions supported in 3D VOPlot.

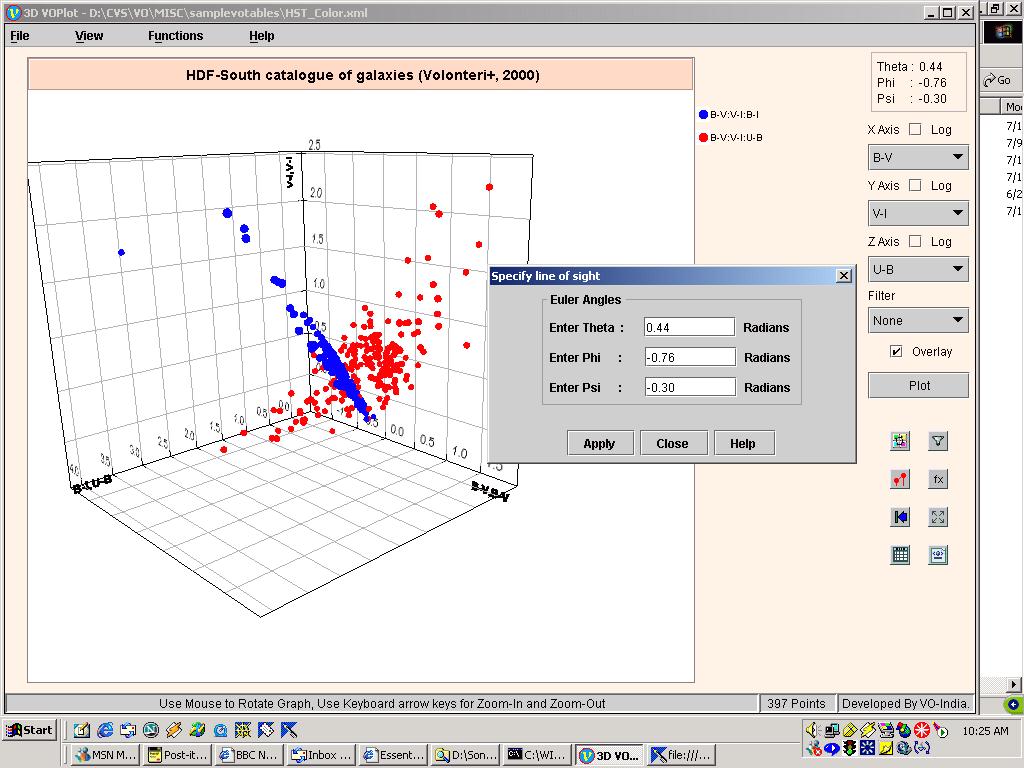
Figure 5: Entering line of sight using Euler angles